
Release 2.0.X (Mar-Now, 2024)
Release/2.0.0 (Mar, 2024)

Release 2.0.0 introduces a major overhaul to the Kurloo Nest interface to improve the usability of the site and let you view and analyse your data more efficiently.
The major changes to the Nest design are:
-
Sleek design:
Say hello to a fresh and modern look! Our revamped website will feature a
sleek design that’s not only visually appealing but also intuitive to
navigate. -
Map centric:
The map is now front and centre in the Kurloo Nest, allowing visualisation
of the location of the Kurloo devices more easily. The map will also appear
more frequently throughout the Nest, such as in the sensors and analysis
pages. -
Enhanced navigation:
Finding what you need will be easier than ever, with enhancements to the map
allowing you to use it to navigate the site. We’ve restructured our
navigation to ensure that you can effortlessly discover and analyse your
data. -
Terminology update:
We’ve listened to our users, and Nodes have now been renamed to Sensors to
be more intuitive.
Release 1.4.X (Jul-Now, 2023)
Release 1.4.0 brings Custom Alignment and on demand reporting functionality to the Kurloo Nest.
Release/1.4.2 (Aug, 2023)
Release 1.4.2 brings battery level alerting and custom height offsets to the Kurloo Nest. On top of those new features there are a number of smaller improvements and bug fixes to the site, as detailed below.
- New Features
- You can now create alerts on the battery level of your devices, giving you an extra tool to manage your devices with

- A project-wide elevation offset can be set, allowing you to view heights on your project datum rather than the ellipsoid height
- Improvements
- The auto report formatting has been updated to improve chart visibility and to show custom alignment values if they have been configured. map view
- Temperature, Pressure, and Humidity overlays on charts are now shown as minimum and maximum daily values rather than daily mean values
- You can now easily open Node details in a new tab from the Node list using the Node name
- Bug Fixes
- Analysis hover tooltips were not showing using the correct project time zone
- Analysis data before the reference date is now visible
- Analyses can be created with a future reference date if you want to set them up before the devices have been installed

Release/1.4.1 (Jul, 2023)
Release 1.4.1 brings small improvements and bug fixes, as well as dependency updates to ensure the Kurloo Nest is kept secure and up to date.
- Improvements
- User diary entries can now be visualized on both Node and Analysis charts
- You can now create an analysis using nodes that do not yet have a reading
- Bug Fixes
- Time zone inconsistencies between rainfall and GNSS data have been resolved
- Other minor bug fixes
Custom Alignment
Kurloo’s new custom alignment functionality allows you to view your measurements aligned to the
structure or landform you are measuring, rather than on compass orientations.
By specifying a rotation angle on your nodes, the measurement axes change from the standard dE, dN, and DH to
axes labelled dX, dY, and dH by rotating the dE and dN axes clockwise by the rotation angle.
dH is unchanged in the rotation, only the horizontal axes are affected.
Custom alignment functionality is enabled throughout the Kurloo Nest, allowing you to create alerts and analyses on rotated measurements.
On Demand Reports
If you have an auto report setup for your project, you can now generate the report on an ad-hoc basis using the new “Report on demand” button on the Reports page.
Release 1.3.X (Jun, 2023)
Release 1.3.0 brings substantial new functionality to the Kurloo Nest, with the introduction of GeoTIFF map overlays. hourly GNSS processing.
GeoTIFF Overlay
The Kurloo Nest uses Google Maps satellite view as the default map background to help you visualise your project.
There are limitations around the usefulness of Google’s imagery since it is relatively low resolution, is infrequently updated, and it is not orthorectified.
For project sites that have changed significantly since the latest satellite image was loaded it can mean the background map image does not adequately represent the site.
To overcome that limitation, Kurloo have developed functionality where a custom GeoTIFF image can be used to visualise the site.
These images are typically generated by drone flights of the site or by services supplying satellite imagery.
If you have a GeoTIFF of your site that you would like to use, or you would like advice on how to create a suitable GEOTIFF, please contact Kurloo Support for assistance.
| File Format | PROJ_DESC | PROJ_DATUM | PROJ_UNITS | EPSG_CODE | Ground Pixel Resolution | File Size |
|---|---|---|---|---|---|---|
|
Geotiff (*.tiff) |
Geographic (Latitude/Longitude) / WGS84 / arc degrees |
WGS84 |
arc degrees |
4326 |
10cm (Recommended) |
Less than 500Mb |
Hourly GNSS Processing
The Kurloo Nest version 1.2.0 and earlier processed data at 11:00am AEST regardless of when the data was collected.
Starting from version 1.3.0, the Kurloo Nest will process the GNSS data received from your devices within 1 hour of reception.
This change means that your data will be made available to you shortly after it has been collected.
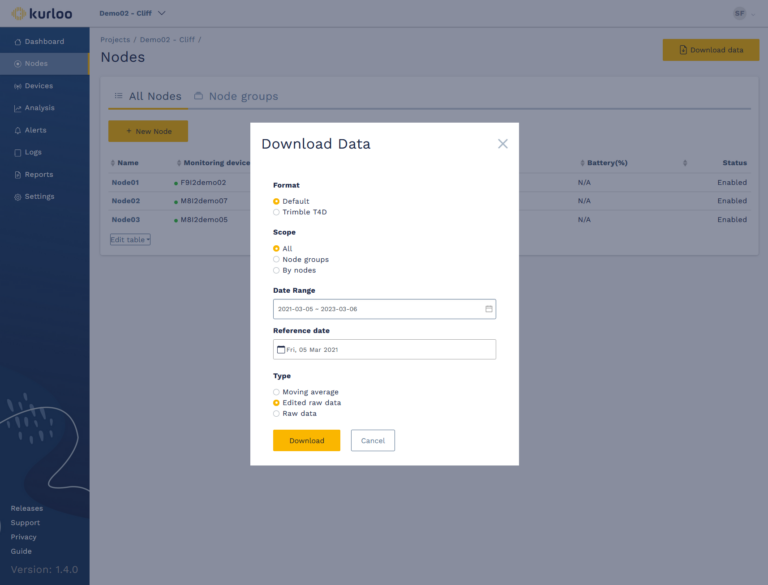
Bulk Node Data Export
Kurloo Nest v.1.3.0 expands on the existing data export functionality by allowing you to download all of your project data at once.
The bulk export can be filtered by date and nodes, and the data source can be chosen from Moving Average, Edited Raw Data and Raw data sources.
Customisable Table Columns
You are now able to select which columns to show in numerous tables shown throughout the Kurloo Nest.
On the node list, for example, you can show various device statuses in the table. This lets you easily see the battery status of all of your nodes,
and lets you sort the list to see which nodes have low levels of charge at a glance.
You will find numerous tables around the Kurloo Nest can now be customised in the same way so that you can see your data more efficiently.
Release 1.2.X (Jun 2023)
Release 1.2.0 brings Time-Based Alerting functionality, as well as other minor improvements and bug fixes.
Release/1.2.3 (Jun, 2023)
Resolved issues
- Fixed: Values typed in any of the wizards is not stored properly.
- Fixed: Logs view does not load the project diaries/system logs correctly.
- Fixed: When the user edits the device details in the Node details page, it failed to update the monitoring device.
Release/1.2.2 (Jun, 2023)
- Support form update (introduce hardware support form)
Release/1.2.1 (Jun, 2023)
- Enhancements
- New diary type called improvements
- Upgrade the invite user dropdown
- Remember the user details in the support form
- Monitoring device edit screen within node photo operation
- Hotfixes
- Auto report failed to get readings
- Alert triggered incorrectly
Time-based Alerting
Time-based alerting allows you to be alerted on displacement of your nodes over a moving window of time.
Previously, alerts were only able to be created with a fixed reference date. This update now allows alerts to be created that look at displacement over a period of time e.g., the last 1 day, 2 weeks, 3 months etc.

Along with time-based alerting, further functionality has been added to alerts to allow you to keep notified
of events in your project. Multiple rules can now be added to each notification, combined with AND or OR rules
to allow more complex notification conditions to be specified.

Additionally, it can now be specified if alerts are generated on edited raw data, or on the moving average data source.
This allows you to do your alerting on the data source that you view your project in.
Other improvements
– The dashboard has been reordered to bring the map to the top to enable easy visualization of your project.
– Added help information to explain options on alerts and analysis pages has been added.
Release 1.1.X (Jan-May 2023)
Welcome to the January 2023 release of Kurloo. There are many incredible new features and updates in this version that we hope you’ll like, some of the key highlights include:
Release/1.1.5 (May, 2023)
- Site-wise
- Fix bugs in some of the wizards that cannot proceed once returning to the previous step
- Custom dropdown list optimization
- Prevent the list closed while selecting multiple items
- Highlight the selected items in the list
- Node groups
- Fix the create/edit screen closed instantly if select an item that is over the window edge
- Node details
- Fix the issue that project admins unable to edit the data removals for the Node
- Some other minor updates
Release/1.1.4 (Apr, 2023)
- Site-wise
- Fix Map marker rendering issues
- Dashboard
- Support negative values sorting in Tables
- UI optimization on the Dashboard alert widget
- Node details/Analysis details
- Fix incorrect rainfall data in the number of days displaying
- Alerts
- UI optimization when creating an Alert
Release/1.1.3 (Mar, 2023)
- Site-wise
- Select drop-down menu optimization
- Improve data loading performance
Release/1.1.2 (Fab, 2023)
- Site-wise
- Allow admin to change the name of the installer
- Directional vector optimization in Map
- Node list
- Fix the nodes list drop-down display issue due to a large number of items
- Node details/Analysis details
- Fix missing rainfall data in the table
- Fix the date range filter referring to a single-day issue
- Remove empty data from Moving Average readings
- Update instruction diagram of ground distance installation
- Alert details
- Add system comment when dismissing a trigger
- Project settings
- Fix the user list rendering issue when adding a new user
Release/1.1.1 (Jan, 2023)
- Site-wise
- Update the privacy policy’s revision date
- Support double sorting (item status > item name)
- Chart zooming style optimization
- Support 2FA prompting
- Node details
- Remove Legend badges from the device status tab
- Disable the click event on the chart legend cell
- Fix historical chart cannot be reopened the issue
- Analysis details
- Remove default legend cells
- Alert details
- Triggers list rendering process update
Release/1.1.0
Ground distance
The distance to ground helps to monitor vertical displacement in centimeters level. You can switch the data representation using the classic chart control bar. The distance to ground can be compared by rainfall data. As the way you are already familiar, the data can be modified by adding offsets and removals if you encountered a case where the pole is extended or a device replacement. The distance to ground data can even be exported along with your other displacement readings for further investigation.
In the Distance to ground tab, you can observe:
- Device registered level (dRL): The altitude captured by the geosystem in each Kurloo device. This indicates the height of the device above sea level by default.
- Ground registered level (gRL): The “Device registered level” minus “distance to ground” that was captured by our built-in ultra-sonic sensor in each Kurloo device. This value indicates the ground level above the sea level.
- Plate registered level (pRL): The Device registered level minus pole height provided by users. This value represents the base plate level above the sea level.
- Soil height (sH): The Ground registered level minus plate registered level. This value tells the height of the covered soil above the plate.
To apply offset and removal, you can check from the Node detail > Expand the “Data removals” or “Offset adjustments” section > Click the “Edit” button. For offset adjustment, you can find the new “Pole length” available when adding a new offset.
Note1: You need to provide the initial pole height to enable this function. To set up, please click Node details on the right side of the information block > click Edit > Initial pole height. The unit is in meters
Note2: The data removals will apply to both “displacement readings” and “distance to ground readings”.
Daily device status
Understanding and tracking your device’s health status is extremely useful and beneficial. Some peculiar readings can be caused by severe weather or other potential events on sites. Except for precaution purposes, the device status can be a valuable resource to gain insights as well. Therefore, Kuloo provides a dashboard that summarises each device’s status each day. We provide an intuitive way to help you evaluate the ideal status of the device as well as its current state. The daily device status allows users to trace back the historical data in a line chart to understand the trends and the environmental changes on your site.
You can now open the daily device status dashboard by clicking the “Daily status average” tab on the Node detail page. To view the historical data, simply click the “Trend” button on the top right corner of each status card.
Note: the daily device status is a summary of each particular day, this does not represent the device status in real-time.
Advanced Node and Analysis
Number of days enabled
We are now providing a whole new way to interpret your favorite monitoring data. You can change the timeline measurement in X-axis from date to “Number of days enabled”. This function is applied to both Node and Analysis and is extremely helpful to compare the readings with how many days each Node is installed. To change the timeline measurement, please click the configuration button (gear icon) > select a preferred X-axis measurement unit.
Exporting data
The export function now includes the readings of the reference station to the base station when exporting a default format.
Powerful chart and table
Based on our constant research on the User experience, the Chart is one of the most commonly used functions in Kurloo Nest. The chart now brings a new feature, zooming, which can greatly save you time. From this Release, you can zoom in/out on the Node detail chart as well as the Analysis detail chart by scrolling the mouse over it. This new feature is applied on both the date and Number of day-enabled views. By doing so, the date range will be updated accordingly. You can reset the chart to its default setting by hitting the reset button.
Map optimisation

Our clients love the directional vector that indicates the 2D displacement direction in map view. Thus, we have decided to implement this extraordinary feature in other commonly used maps including the Dashboard page and Node detail page. Other cool updates such as:
- Flexibility: There is a new toggleable option to display the directional vector on the map widget of the Dashboard view.
- Readability: We have also optimised the directional vector color to keep it clear and readable on the satellite view.
- User-friendly: Instead of double-clicking, the map now can display the Node name label just by the hovering mouse over the selected Node.
- Powerful selector: We are now improve the map that be able to auto-focus on the toggled group.
Better email notification
We constantly improve user experience, and this time we take this approach even further to optimise the information in our email notifications. This includes:
1. Node name: The name of each Node in the email is now displayed in the customised names, we encourage every user to set up their preferred and descriptive Node name.
2. Ongoing triggers: The system now can track the ongoing triggered Nodes and will push notifications based on the emerging outbreaks. This means you will be notified through email only if any ongoing breaches are triggered.
Styles and User experience
We are dedicated to improving the user experience of our platform, Kurloo Nest. This means you may find some styling upgrades that help you to focus on your task, easily search for items, or switch between functions.
Others
We have fixed some of the bugs from the reported issues.